Course Introduction
Course Overview:
This hybrid 5-day program blends on-site collaboration with online learning to equip professionals with end-to-end skills in data analysis, visualization, and storytelling using Tableau, the industry-leading visualization tool. Participants will progress from foundational statistical concepts to advanced dashboard design, culminating in a capstone project that synthesizes technical expertise with persuasive presentation skills. Designed for hands-on learning, the course integrates real-world datasets, interactive labs, and personalized coaching to transform raw data into actionable insights for decision-makers.
Learning Objectives:
By the end of this course, participants will be able to:
- Clean and Prepare Data: Use Tableau Prep to manage missing values, outliers, and data structuring for analysis.
- Apply Statistical Techniques: Conduct hypothesis testing, time-series forecasting, and inferential analysis to drive data-driven conclusions.
- Design Interactive Dashboards: Create visually compelling, user-friendly Tableau visualizations (charts, maps, graphs) that highlight key trends.
- Communicate Insights Effectively: Translate complex findings into clear, stakeholder-focused narratives using storytelling principles.
- Solve Real-World Problems: Address business or policy challenges through a capstone project, from data exploration to presentation.
Course Fees: 1250 USD,
Early Bird Fees 1100 USD : Apply by 6th June 2025
Course Structure:
Day 1 (On-Site): Foundations of Data Exploration
- Session 1: Orientation & Data Familiarization
- Introduction to the data lifecycle and course tools (Tableau, Excel).
- Hands-on activity: Profiling datasets to identify variables, patterns, and quality issues.
- Session 2: Data Ethics & Governance
- Best practices for data privacy, bias mitigation, and reproducible workflows.
Day 2 (Online): Statistical Analysis & Visualization Basics
- Session 1: Descriptive Statistics & Inference
- Calculating measures of central tendency, dispersion, and confidence intervals.
- Hypothesis testing: t-tests, ANOVA, and p-value interpretation.
- Session 2: Time-Series Analysis & Forecasting
- Trend decomposition, seasonality adjustment, and ARIMA basics.
- Lab: Predicting sales or economic trends using historical data.
Day 3 (Online): Data Wrangling & Visualization with Tableau
- Session 1: Data Preparation in Tableau Prep
- Cleaning, blending, and transforming data for analysis.
- Session 2: Advanced Tableau Visualization
- Designing interactive dashboards: Parameters, filters, and calculated fields.
- Best practices for color theory, layout, and accessibility.
Day 4 (Online): Coaching & Storytelling
- Session 1: Group Coaching
- Personalized feedback on capstone projects (data gaps, model refinement).
- Session 2: Data Storytelling Workshop
- Crafting narratives with the "STAR" framework (Situation, Task, Analysis, Result).
- Tailoring presentations to technical vs. non-technical audiences.
Day 5 (On-Site): Capstone Presentations & Graduation
- Group Presentations: Teams showcase capstone projects, highlighting problem-solving, analysis, and visualization skills.
- Feedback & Awards: Peer reviews, instructor critiques, and certificate ceremony.
Key Features:
- Blended Learning: Combines in-person collaboration with flexible online modules.
- Capstone Project: Solve a real business/policy challenge (e.g., customer segmentation, policy impact analysis).
- Tool Mastery: From Tableau Prep (data cleaning) to Tableau Desktop (advanced dashboards).
- Industry-Ready Skills: Focus on stakeholder communication, ethical analysis, and reproducibility.
- Take-Home Toolkit: Access to datasets, Tableau templates, and curated resources.
Who Should Attend:
- Data analysts, business intelligence professionals, and marketers.
- Policy analysts, NGO staff, and researchers seeking to visualize impact.
- Managers and academics wishing to interpret or present data effectively.
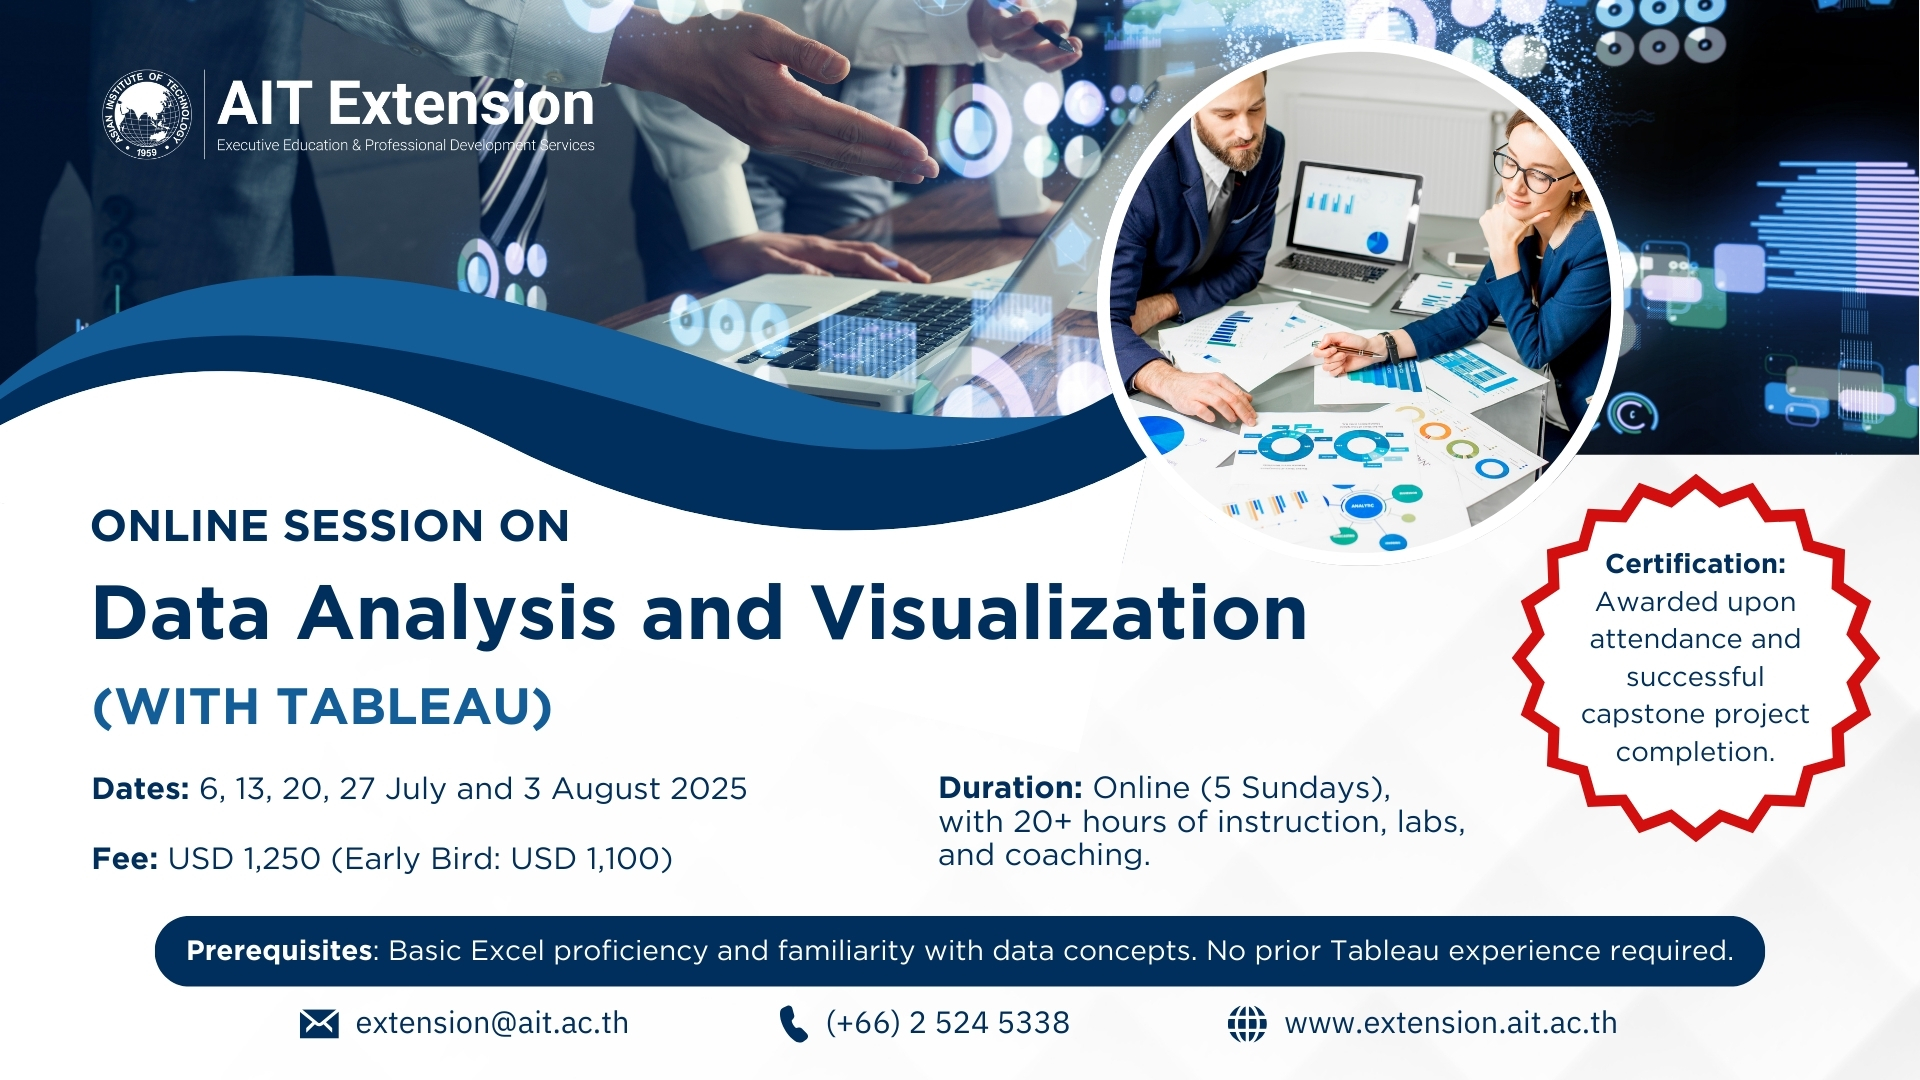
Prerequisites: Basic Excel proficiency and familiarity with data concepts. No prior Tableau experience required.
Certification: Awarded upon attendance and successful capstone project completion.
Duration: 5 days (3 online, 2 on-site), with 20+ hours of instruction, labs, and coaching.
Outcome: Graduates will leave capable of leading data-driven projects, designing persuasive visualizations, and influencing decisions with clarity and confidence.
This course bridges the gap between technical analysis and strategic communication, empowering professionals to turn data into a competitive advantage.
Tuition Fee
USD1250.00
Tuition Fee THB
฿ 41500.00
Date Range
06 Jul - 03 Aug 2025